STRATEGIC PLANNING & BUSINESS DEVELOPMENT
Enhancing Health Care Strategy Using Geographic Information Systems
Geography as a science is defined as a study of people, places and their interactions, which makes taking a geographic approach to problem-solving effective for health systems in an increasingly complex, interconnected world. That was the theme of a session focusing on the use of geographic information systems (GIS) to inform decision-making, held during the 2024 SHSMD Connections Conference in October 2024.
“Geography helps us to organize what happened, when it happened, and where it happened,” explains presenter Este Geraghty, MD, MS, MPH, GISP, Chief Medical Officer at Esri, the GIS software developer based in Redlands, Calif. “It helps us to see the world as the interconnected ecosystem it is and to identify relationships and patterns and intelligently respond to challenges.”
As an example of the power of geography, all of the factors in social determinants of health can be mapped, analyzed, understood and acted upon, she says.
Essentially, GIS is the technology that enables a geographic approach to problem-solving, according to Dr. Geraghty. The platform features tools designed to assist in data collection and management, visualization and mapping, analysis and modeling, planning and design, decision-making, and action and evaluation, she adds.
“GIS is actually a lot more than a map,” Dr. Geraghty notes. “In health care, we can use GIS to make data-informed decisions, take action and evaluate the impact” of these decisions.
She and her colleague, Kymberli Fieux, Commercial Health Team Lead at Esri, were joined by Nathanael Stanley, PhD, MA, Applied Research Scientist, Office of Community Outreach and Engagement, Moffitt Cancer Center, in Tampa, Fla., and presented examples of GIS-fueled workflows and how they can be used in decision-making in health care systems.
What Is GIS?
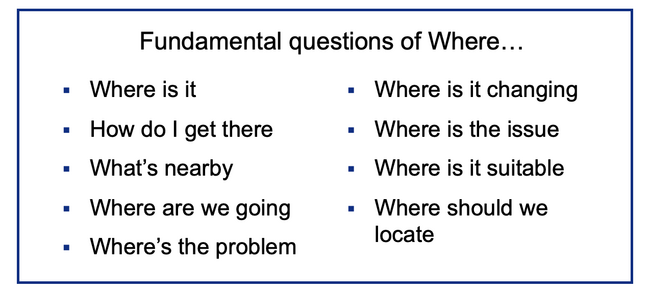
Simply put, GIS is software that uses location data to enable decision-makers to ask and answer questions involving where something is and how that location relates to other factors. The questions GIS can answer include:
- Where is it?
- How do I get there?
- What is nearby?
- Where are we going?
- Where is the problem?
- Where is it changing?
- Where is the issue?
- Where is it suitable?
- Where should we locate?
“There are many fundamental questions of ‘where’ that we’re asking all the time,” Dr. Geraghty notes. “When it comes to our health, it’s been said that our ZIP code is more important than our genetic code.”
Dr. Geraghty believes that “contextual part” is generally underrepresented in decision-making processes, which is “unfortunate” because “understanding context brings tremendous value.”
How GIS Works
One particular benefit of GIS is that it can enhance understanding of health needs within local communities.
Fieux cites the example of triannual community health needs assessments (CHNA), which are a federal requirement for nonprofit hospitals.
GIS can be an invaluable asset to nonprofit hospitals to be able to tell their story and show their value, she explains.
“When your CHNA data is digital and standardized, you can do a lot more with it, like support your broader strategic plans, inform your community benefit initiatives, and pursue collaborations where everyone can rely on the same authoritative data,” Fieux adds. “GIS can also make it easy to share your CHNA publicly in ways that not only comply with the law but also encourage innovation and local partnering. GIS can help nonprofit hospitals effectively present their contributions, alleviating concerns and emphasizing their ongoing commitment to community health.”
In general, according to Fieux, using GIS in this process can:
- streamline and standardize CHNAs;
- allow hospitals to use the CHNA to define and prioritize their implementation strategy;
- enable hospitals to further leverage the CHNA in hospital strategic plans for population health management, service reconfigurations, and community benefit plans and allocations;
- empower health systems to share CHNA and community benefit data transparently and interactively;
- foster proactive collaborations within the community; and
- assist in tracking efforts and monitoring spending and progress.
Fieux provided some real-world examples of how GIS can be used in the CHNA process, noting Esri offers a preconfigured tool that gives GIS users the option to streamline their survey and select a study area and random household clusters following the WHO’s CASPER methodology.
“That makes it pretty handy for regular health assessments as well as rapid needs assessments, like when a disaster strikes and you need quick information,” she notes.
Once community neighborhood clusters are selected for surveying, field teams can be assigned to them.
“You can easily make those assignments, provide useful comments and send the information, along with a digital map of the area assigned to each team member,” Fieux explains.
Following team assignments, the GIS-based survey can be used as is or be customized where users can easily add new questions, modify existing questions, or hide questions they don’t want to use. The Esri health assessment solution features a connected dashboard that incorporates data from surveys as they are submitted in real-time.
“Operationally, we can see how well the field teams are doing in terms of efficiency, whether householders are being cooperative with the assessment, and the overall progress toward completion of all required surveys,” Fieux notes.
Householder responses are displayed on a separate dashboard, which can be configured to show information in ways that enhance understanding and decision-making, according to Fieux. “You can show any and all of the metrics you want,” she adds.
One of Esri’s clients, Providence Health, a nonprofit system that serves primarily the West Coast and Pacific Northwest, has been using GIS for their triannual CHNAs, engaging the software to identify and improve the top community health need in every region they serve. The system’s corporate vision stresses improving population health outcomes, especially for the poor and vulnerable.
GIS has enabled the health system to define their service areas, based on accessibility, for each of their 51 hospitals and to develop priority areas for the implementation plans. Using data resources such as the American Community Survey, the Behavioral Risk Factor Surveillance Survey, as well as their own data resources, they’re tracking measures related to economic stability (like income data, housing costs, and SNAP food program enrollment), mental and physical health indictors (mapping local rates of specific diseases like diabetes, cardiovascular disease and obesity) and statistics about how residents are “keeping up with their overall health maintenance by coming in for annual checkup appointments,” Fieux notes.
Each of their mapped indicators is positioned alongside their internally developed composite index called The Providence Need Index. GIS is “helping them strategize, allocate funds and work with local partners for real results, especially for those with the greatest needs,” she adds.
The Providence Need Index is an example of a spatial composite index, which allows for the inclusion of “a myriad of data variables,” according to Dr. Geraghty. A composite index is a tool that enables organizations to combine different types of information into a single, comprehensive measure.
“For example, one might combine indicators related to a person’s genetics, their environmental circumstances, and their lifestyle and behaviors to be able to predict their overall health and longevity,” she explains. “People use these indices because they’re convenient. They provide an integrated view of health issues across an area of interest. When we take a geographic approach with an index, we can visualize and analyze these phenomena in context, which then supports our ability to intervene, allocate resources effectively, and improve equity in our decision-making.”
Moffitt and GIS
Moffitt, meanwhile, sought to use GIS data in strategic planning, specifically for community outreach and research engagement, according to Dr. Stanley. As part of that, Moffitt used GIS to base expansion of its catchment area from 15 counties to 23, assisting in the process of identifying specific regions to include in the expansion. At the time, 28 of the 67 counties in Florida were not covered by an academic cancer center.
GIS enabled Moffitt to model and evaluate several expansion scenarios based on multiple variables and identify the areas of greatest need. The platform enabled the creation of customized data sets, which Moffitt enhanced using statistics from regional cancer registries and other essential information, including vulnerable populations.
One area in which GIS was particularly helpful was in assisting Moffitt in analyzing how population shifts in the Tampa area—the region saw significant growth during the COVID-19 pandemic as people moved there from the northeastern United States—might influence the need for their services. GIS also enabled them to drill down to specific socioeconomic and demographic trends within this changing population.
“GIS saved us time, which saved us money, and the data we aggregated can be easily tracked down, replicated and updated,” Dr. Stanley notes. “The less time your analysts spend finding and cleaning [data] and getting it into a usable format, the more time they can spend looking in depth into the data to find those real pieces that will lead to actual insights that will help your organization move forward.”
