
It’s a trip.......data that is! Where is your map?!?!
As Mark Twain so brilliantly coined, “data is like garbage. You’d better know what you are going to do with it before you collect it.” Another brilliant author and economist, Ronald Coase, wrote, “Torture the data, and it will confess to anything.” This CQVA team at this IDN has quickly uncovered and coined, “we need to know where the data is, determine if its useable data, and then find a path to automation.” Data has always been the foundation for every answer and discussion with our clinicians, vendors, and hospital administrators. The biggest hurdle many of us in the industry face with data is “Where do we go?”, “What system(s) give us what we need?”, and “Why isn’t all our data in one system?” The following demonstrates the path of how one health systems clinically integrated value analysis team(s) found success with data in true to life examples.
- Data maps
- What is available to us and where do we go?
- Define the data or what type of data do we need?
- P.O. data (eliminate unless used for all “a-e”)
- Utilization data
- Category management
- Clinical data (LOS, Wheels in-out, Complications, Data driven best practice)
- Order in which data is collected
- Impact of utilization and accurate data on strategic sourcing
- Excess data?
- Future opportunity
- Reprioritization of your work
- Refinement of understanding your clinical or non-clinical space’s data sets
 The value analysis team(s) started by mapping out their organization’s documentation formats (ie: ERP-EHR-Excel-Paper).
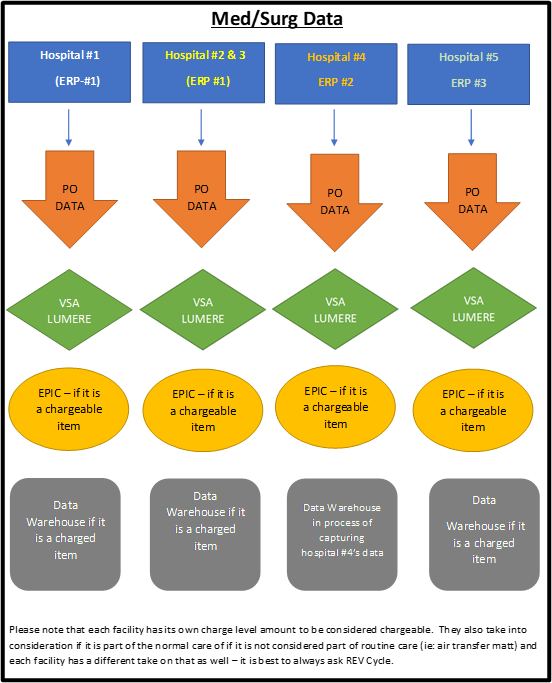
In this mapping example for our med/surg value analysis committee, we can see there is a heavy reliance on the p.o. data (VSA/Lumere). The data is specific to purchase history rather than utilization history. This organization also had the opportunity of facing what is chargeable vs. not chargeable. This created variation in what was able to be captured from a clinical utilization perspective. The other opportunity that this organization was finding solutions for was working through 3 different ERP systems and how each facility was managing their inventory in different ways such as the lowest unit of measure (LUM) or how they were procuring the product (i.e.: distribution or direct). This meant there were several pathways to validate data the Med/Surg Value Analysis Committee or Subject Matter Expert (SME) group worked together to formulate a road map and strategy. The value analysis coordinator and team ensured the data was well networked and understood prior to project planning. This med/surg committee found the greatest success of validating data through clinical practice discussion with bedside nurses. It was critical to have the discussion with the bedside nurses to truly understand utilization. It also allowed the group to further understand the clinical application of the products. Often the challenges that med/surg would face were not the same for data management within surgical services.
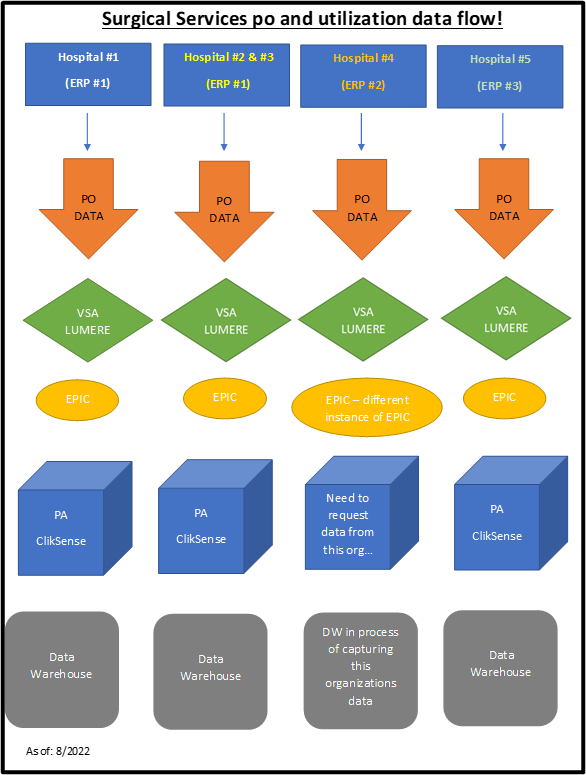 Surgical Services relies on many purchasing and data collecting houses (VSA, PA, Qlik Sense, HL, and Lumere) to navigate data. To ensure data is validated and aligned in the same data formula for each facility, the CQVA coordinator and data analyst review PO and utilization at each site. This includes reviewing LUM string and purchase quantity align with the price for the item. If one facility is purchasing a case of products and the other is purchasing at the each (EA) level of a product, the coordinator must confirm that the quantity in purchasing unit of measure (UOM) is comparable for all sites.
Surgical utilization and cost data is impactful by reviewing total spend of products at each facility while conducting a category management review. This can help define market share for each facility and provide a system lens to develop a road map to strategy. The data is critical to understanding market share, utilization, contract optimization and sustainability initiatives. Surgical products at this system are captured within EPIC and it allows this system to focus in on surgeon level utilization by facility and procedure. Value Analysis and the SME group can then complete a peer-to-peer comparison and identify comparable variables identified by the SME groups such as length of stay (LOS) and complication rates along with attributes of each supplier and device in a category.
For example, in this organizations latest advanced energy/vessel sealing project the CQVA coordinator in collaboration with the physician and nursing chair reviewed physician-level utilization data. We identified providers who perform the same procedure but have a variance in the cost of products per case and at times using more than 1 of the same product(s) when their peers had not. It was determined that even though two surgeons are performing the same procedure, there could be a wide range of total cost of supplies. These variances can be attributed to using a different energy device on the same type of procedure or using more than one energy device per case. By identifying these clinician variances, we can further define the category and drive more compliant utilization to ensure forecasted savings through education and strategic sourcing was achievable. This also started and propelled the conversation for data driven/empowered conversations between peers.
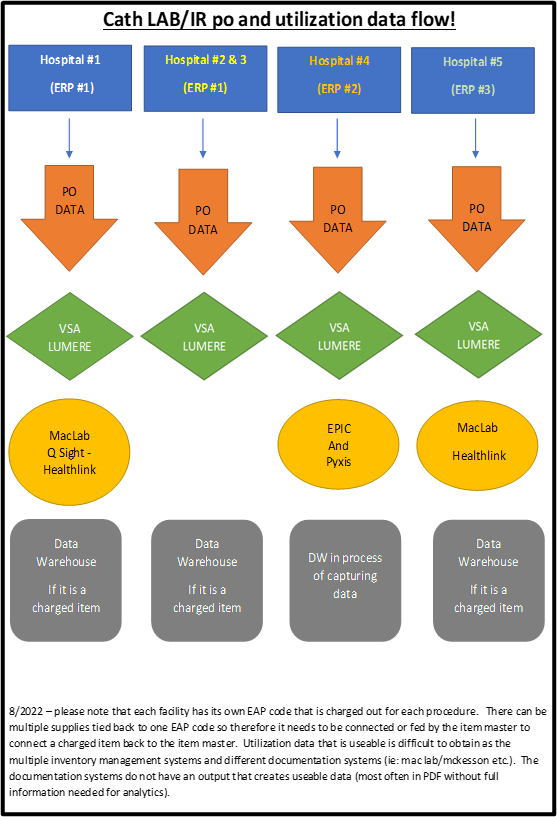
The greatest advantage that most perioperative services areas have is the commonality of the EPIC platform or another electronic health care record to document supplies, implants, and patient vitals/outcomes in. The industry landscape within the Cath Lab’s and IR departments haven’t always been as fortunate. In this systems approach to finding a solution to the clinically integrated data systems it was imperative to understand the data map. The data opportunities the Procedural Value Analysis Committee needed to understand were:
- Multiple inventory management systems (ie: Omnicell, Pyxis, QSight, or manual inventory systems)
- Different documentation systems within the cardiac space
- Functionality of data outputs within these systems
- EAP codes associated with multiple different deviceS
 The ability for the procedural value analysis committee to be able to pivot creating a road map to discovering pathways was critical to the success of category management and understanding what our value analysis and strategic sourcing initiatives were doing for the physicians and patients, but also creating transparency to best practice and peer review. This was also the instance in the surgical space where the data enhanced our strategic sourcing opportunities and peer reviewed conversations for best practice and understanding.
Of the three value analysis areas, this was the most challenging of data sets to capture since there was the greatest amount of variation in documentation inputs, formats, and outputs. The solution this Value Analysis work group came up with is utilizing QSight data at Hospital #1, Pyxis Data at Hospital #4, and Health-link/Epic charge data from Hospital #5. As these data sets were all coming from different software programs it was essential to build one integrated excel file for data upload and automation at the time of upload.
The 3 clinically integrated value analysis teams realized that to fully understand their supply chain and clinical data it was going to be integral to having a road map to harvesting and understanding the data. In conclusion, not all the data challenges are resolved through a road map of “where to get” your data. Rather this served as a springboard for this system to enhance data integrity from how they documented, how they pulled the data, as well as how they manipulated and presented the data. As we all know, until data is automated and there is the element of the human touch, data will always have some element of variation or inconsistency that will need value analysis. And, as always in building these roadmaps, these groups would not have been successful without the assistance from cross functional teams within their organizations such as rev cycle, finance, informatics-data experts, project management and truly exemplifying AHVAP’s motto of “Together in Value.”
Co-Authors:
Sarah Richards, RN Surgical CQVA Coordinator
Mary Swearingen, RN CQVA Coordinator
Jennifer Linsenmeyer, RT Procedural CQVA Coordinator
Melissa Meister, RN Med/Surg CQVA Coordinator
Andrew Kaiser, MBA, RRT, CVAHP, System Clinical Quality Value Analysis Director
Editors:
Pramod Shakya * Beth Potter RN, CVAHP * Toni Young, MSN, BSN, RN, CVAHP
![]()
![]()
![]()
