
DAT Weekly Trendlines Report – Peak Season Is Still Ahead for Spot Market Freight
Print this Article | Send to Colleague
| Week Ending Dec. 1, 2018 |
|
Once upon a time, Black Friday marked the end of the retail freight season. Those days are gone. E-commerce has disrupted that traditional freight schedule. While brick-and-mortar stores still need to stock shelves before Black Friday, the online activity that fuels a larger and larger portion of truckload demand every year will continue right up until Christmas and even into the first week or two of January, when people are cashing in their gift cards or exchanging unwanted items. The brick-and-mortar stores restock more aggressively in December and January than they did in the past, to compete with e-commerce vendors. Activity on the DAT Load Board shows how the new freight trends play out. Those and other indicators tell us to expect rising rates in December. We typically look at the load-to-truck ratio as a way to measure how hot demand is for freight – the number of load posts divided by truck posts. The ratio for dry van freight surged last week to 7.2 loads per truck, an indicator of more retail freight to come. Demand for reefer trucks also rebounded last week, to 8.3 loads per truck, after a Thanksgiving week lull. Reefer demand could get hotter as supermarkets and restaurants prep for Christmas. Pressure Is Less Intense than It Was Last Year That'll probably take some drama out of this year’s retail season, but it won’t keep spot market rate increases from accelerating before the end of the year. In fact, rates have already been rising on the majority of the 100 highest-volume van lanes, especially those that move retail goods from west to east and south to north. |
 |
|
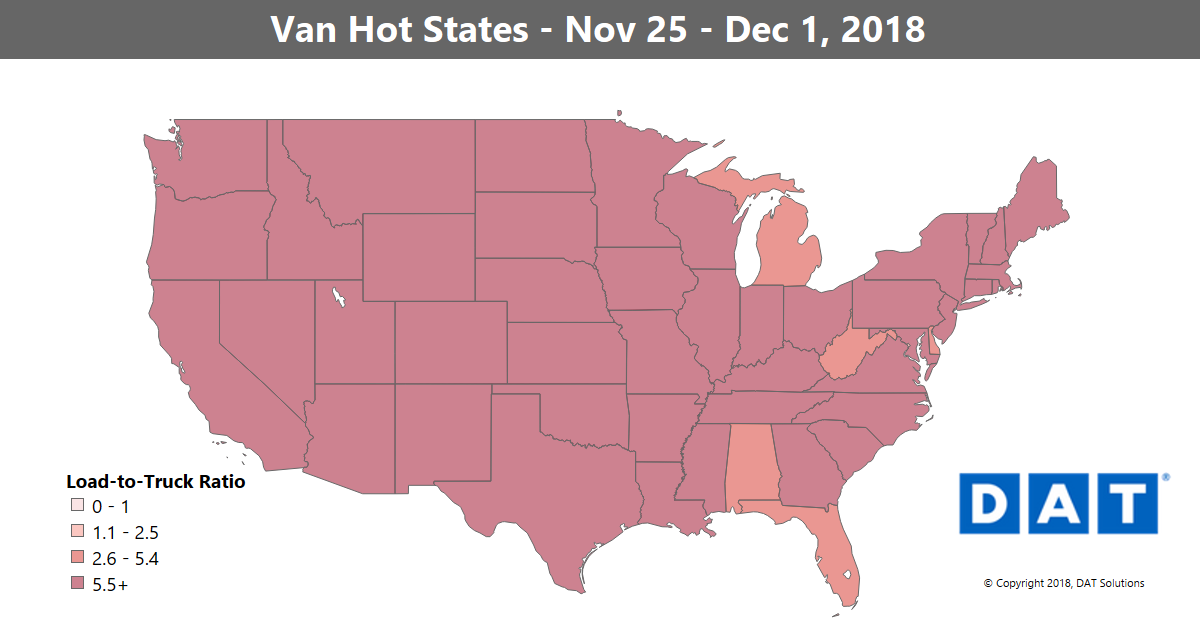
Pressure is building on spot market van capacity, as shown in last week’s DAT Hot States Map. The national average ratio rose to 7.2 loads per truck for dry vans last week, and rates are rising on a majority of the highest-volume lanes. For more spot market trends, visit www.dat.com/trendlines. |
![]()
![]()
![]()
