
DAT Weekly Trendlines Report – Spot Rates Edge Down From Record Highs, as Contract Rates Keep Rising
Print this Article | Send to Colleague
| Week Ending July 28, 2018 |
| Spot Rates Edge Down From Record Highs, as Contract Rates Keep Rising |
|
The national average van rate edged down to $2.30 per mile during the past week, which is only a penny lower than the average for June. The rolling average for July is still trending down, but it’s not likely to move a lot more before August restarts the clock on Wednesday. That makes this a remarkably strong July, which has historically been a quiet month for trucking freight. To put July in context, remember that spot market rates in June hit the highest monthly average for vans, reefers and flatbeds since 2010, when DAT established the original spot rates database. It’s reasonable to assume that June spot rates were the highest ever, but there was simply no supporting data before 2010. So if July rates land a couple of pennies below June, that’s still crazy high. Contract van rates are also the highest ever, but unlike spot rates, average pricing on longer-term, shipper-to-carrier contracts continued to rise in July. When the average fuel surcharge is added, contract carriers are getting $2.36 per mile, while spot market transactions paid $2.30 to the truck. That six-cent gap between spot market and contract rates may widen in the third quarter, as contract rates continue to trend up. Then the gap could narrow again before the end of the year, as spot rates respond to seasonal pressure. That happened in Q4 2017, and this year’s fall freight season could be even more intense. We’ll know more in a few weeks. |
 |
|
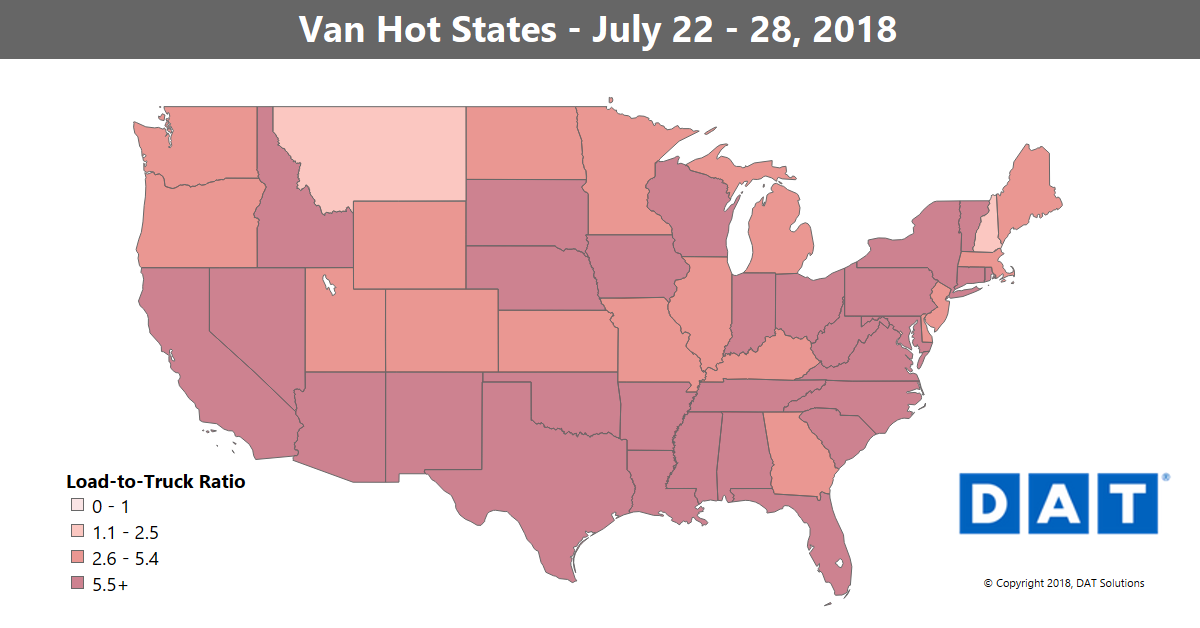
Van rates dropped back to $2.30 per mile as a national average for the month to-date, in the week ending July 28. It’s the third week of declining rates, but the national average is still close to the all-time record set in June. The load-to-truck ratio declined to 6.9 loads per truck, with tight capacity in distinct regions across the South, along both coasts, and in parts of the Midwest. Despite seasonal declines, July will go on the books as the second-strongest month this year for van ratios, and second-strongest for rates since at least 2010. NOTE: The map depicts outbound load-to-truck ratios for reefer. The load-to-truck ratio represents the number of loads posted for every truck posted on DAT load boards. The ratio is a sensitive, real-time indicator of the balance between demand and capacity. Changes in the ratio often signal impending changes in freight rates. For more details on spot market capacity and rates, visit DAT.com/Trendlines |
![]()
![]()
![]()
