
Logistics Manager's Index - Official Release of the May 2019 Issue
Print this Article | Send to Colleague
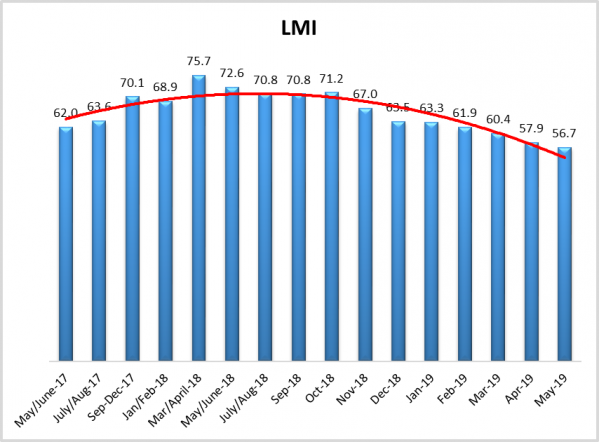
The overall LMI score for May 2019 is 56.7, down from April's reading of 57.9. It is the lowest score in the history of the index and down significantly from this time a year ago when it registered at 72.6. With that being said, May's score is still above 50.0, which indicating growth (albeit at the slowest rate in over 2.5 years).
Warehousing Capacity and Transportation Capacity are both reported to be contracting. Warehousing Capacity has been contracting for most of 2019, but this is the first time in the history of the LMI that we have seen a contraction in Transportation Prices. Transportation metrics have been the most dynamic over the history of the LMI®. With an index score of 48.6, Transportation Prices (-3.58) are contracting for the time in the history of the LMI®. This is a far cry from May 2018 when this metric was growing a rate of 94.0. The change index used by the LMI® ranges from 0-100, so to go from growing at essentially the fastest rate possible to contracting in the span of 12 months suggests a significant shift in the market. This decrease came with Transportation Capacity (-4.73) still reporting solid (if slightly decreased) rates of growth at 67.29.
As was speculated in last month, there may have been an inflection point in April 2019, with the rate of growth in Transportation Capacity surpassing that of Transportation Prices (which is not contracting). In March/April 2018, the index score for Transportation Price was 65 points higher than for Transportation Capacity. Today, Transportation Capacity is higher by 18.7 points.

The logistics industry is still growing, but at a slower rate than it had for most of 2018. We are interested to see if these trends will continue, and we hope that you will consider taking 2-3 minutes to participate in the June survey.
Movement in the individual components of the LMI are broken down in the table below:
When interpreting our results, any value about 50.0 indicates growth, and any value below indicates contraction. Higher Numbers = More Growth, Lower Numbers = More Contraction. This reading marks two years and 15 consecutive readings indicating growth in the logistics industry. However, it also marks six consecutive periods of declining rates of growth. For a more comprehensive discussion of the April 2019 report, access the PDF or access online here: May 2019 LMI Report Online.
The Logistics Managers Index is a bi-monthly cooperative research venture between several supply chain management universities and CSCMP. We collect data having to do with trends in Warehousing, Transportation, and Inventory across a wide spectrum of industries.
Participate in the June 2019 reading of this survey.
