
March/April 2018 Edition of the Logistics Manager's Index
Print this Article | Send to Colleague
The Logistics Manager’s Index (LMI) report was issued last week by researchers at Arizona State University, Colorado State University, Portland State University, Rutgers University, and the University of Nevada, Reno, and in conjunction with the Council of Supply Chain Management Professionals (CSCMP). According to a sample of North American logistics executives, economic activity across the logistics sector expanded, primarily driven by increases in price, utilization and inventory levels from March to April of 2018.
The LMI is calculated using a diffusion index, in which any reading above 50 percent indicates that a given portion of the logistics industry is expanding, and a reading below 50 percent indicates that a given portion of the logistics industry is contracting.
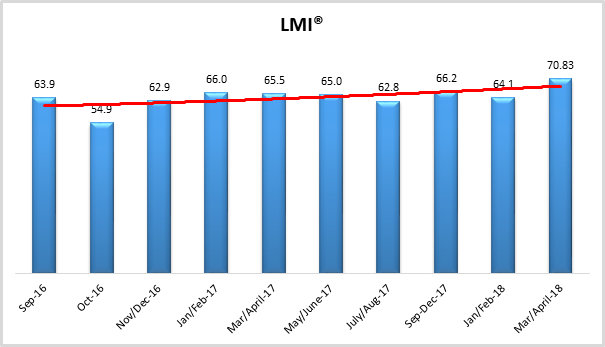
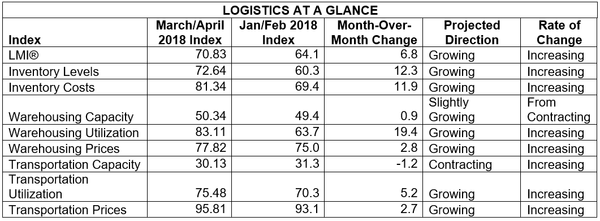
The March/April reading of the overall Logistics Manager’s Index® registered 70.8 percent which is far and away the greatest rate of growth we have tracked in the 20 months of the LMI, up, 6.4 percentage points from the January/February index reading of 64.1. The rate of growth is driven by index highs in Inventory Levels (72.6), Inventory Costs (81.34), Warehousing Prices (77.8), Transportation Prices (95.8) and a stunning 19.4 percentage point increase in Warehousing Utilization (83.1). The overall index score is tempered by an all-time index low in the availability of Transportation Capacity (30.1). Warehousing Capacity has reached a steady state, with an index score of 50.3 indicating little-to-no change in the availability of new warehousing space. However, it would still appear that the demand for warehouse space is growing and outstripping available capacity as this period’s index sees a marked jump in the utilization of available warehousing space, indicating that firms are more thoroughly utilizing the space that already exists.
Growth in Warehouse Prices has been trending upward since July/August of 2017, and Transportation Prices have been steadily increasing over the same period. Transportation Prices continues to grow at a greater rate than the other components of the LMI. This period’s index score of 95.8 is the highest ever measured for any component of the LMI. This is partially driven by low levels of available Transportation Capacity, this period’s reading of 30.1 is the lowest in the history of this index. Available Transportation Capacity continues to be insufficient in comparison to demand. There appears to be little hope on the horizon for a relief from this situation, when asked to predict the transportation capacity and prices 12 months into the future, respondents predicted a diffusion index of 38.2 for Transportation Capacity and a corresponding Transportation Price index of 93.8. Clearly firms are expecting a continuing shortage of available transportation, and a subsequent increase in prices.
Transportation typically functions as a leading indicator of overall economic health. The dramatic contraction in Transportation Capacity, combined with the steep, continuing growth in Transportation Prices indicates that demand is high and the industry is healthy. The increase in Inventory Levels and Warehousing Price are further evidence that the demand for available logistics capacity remains high, while available supply seemingly struggles to keep up.
To participate in the May/June reading of the Logistics Manager’s Index, please consider taking our 2 minute survey at logisticsindex.org.
Author:
Zac Rogers, Assistant Professor of Supply Chain Management, Colorado State University, CSCMP Member
