Statistics: Brazil, Georgia, Indiana Mount Vernon, Los Angeles/Long Beach
 Print this Article | Send to Colleague Print this Article | Send to Colleague
Brazil: Port Cargo Tonnage, TEU Count set Records in 2014
A record 969.6 million metric tons of cargo moved through the Brazilian port system in 2014, according to data compiled and reported by the national waterways agency, Agência Nacional de Transportes Aquaviários (ANTAQ). It was the fifth consecutive year of record tonnage and an increase of 4.1 percent, or 38.6 million tons, from 2013. Total trade includes foreign, cabotage and "inland navigation" cargo handled at the nation’s "organized ports" and "private use terminals." Brazil’s waterborne trade tonnage exceeds that of every country in the Western Hemisphere except the United States.
|
Ports of Brazil
CARGO TRAFFIC 2014 - 2010 |
|
|
Calendar Year |
2014 versus |
|
2014 |
2013 |
2012 |
2011 |
2010 |
2013 |
2012 |
2011 |
|
Container TEUs |
9,966,769 |
8,989,154 |
8,189,386 |
7,934,721 |
6,822,657 |
10.9% |
21.7% |
25.6% |
|
Cargo, Metric Tons |
|
FOREIGN |
714,416,364 |
685,843,698 |
670,253,686 |
658,095,639 |
616,089,467 |
4.2% |
6.6% |
8.6% |
|
Imports |
181,931,004 |
153,051,922 |
144,822,121 |
143,347,478 |
126,800,275 |
18.9% |
25.6% |
26.9% |
|
Exports |
532,485,360 |
532,791,776 |
525,431,565 |
514,748,161 |
489,289,192 |
-0.1% |
1.3% |
3.4% |
|
CABOTAGE |
211,758,947 |
204,657,922 |
201,015,907 |
193,469,337 |
185,822,682 |
3.5% |
5.3% |
9.5% |
|
INLAND NAVIGATION |
38,887,335 |
35,213,297 |
29,894,867 |
31,638,112 |
28,382,719 |
10.4% |
30.1% |
22.9% |
|
MARITIME SUPPORT |
2,935,311 |
3,890,924 |
1,528,239 |
1,520,588 |
2,112,012 |
-24.6% |
92.1% |
93.0% |
|
PORT SUPPORT |
1,649,919 |
1,439,352 |
1,072,775 |
1,331,601 |
1,528,855 |
14.6% |
53.8% |
23.9% |
|
TOTAL CARGO |
969,647,876 |
931,045,193 |
903,765,474 |
886,055,277 |
833,935,735 |
4.1% |
7.3% |
9.4% |
|
Source: Agência Nacional de Transportes Aquaviários(ANTAQ), Anuário Estatístico Aquaviário 2014-2010 |
Across the board gains were posted by all four cargo groupings, mostly strongly by liquid bulks and non-containerized general cargo. Leading cargos were iron ore, fuels, containerized goods, soybeans and soybean products, bauxite, corn, fertilizers, sugar, coal, steel, wood fiber, petroleum coke, wheat and organic chemicals.
As shown in the attachment, foreign trade rose 4.2 percent to 714.5 million tons, with imports accounting for 181.9 million tons ( 18.9 percent) and exports for 523.5 million tons (-0.1 percent). The cabotage trades – that is cargo shipped by sea between Brazilian ports – increased 3.5 percent. An additional 38.9 million tons of domestic cargo was transported via Brazil’s inland rivers. The container count jumped 10.9 percent to an all-time high of nearly 10 million TEUs.
Georgia Ports Box Count Tops 333,000 TEUs in March
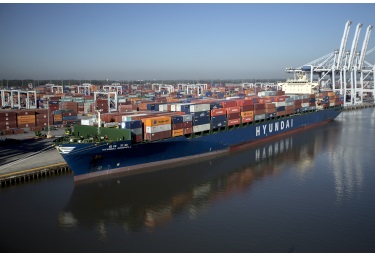
The Georgia Ports Authority reports box throughput at its Garden City Terminal in the Port of Savannah soared to a monthly high in March of 333,058 TEUs. That was up 27.8 percent from a year ago and beat the previous monthly record, set in October 2014, by more than 21,000 TEUs.
"We are moving record volumes while maintaining excellent service levels for our customers," said GPA Executive Director Curtis Foltz. "Our March numbers have once again demonstrated the scale, flexibility and efficiency of the Garden City Terminal. Freight handling remained fluid, even with demand well above forecasts."
The GPA is boosting capacity at Garden City by adding a truck gate and increasing its rubber-tired gantry crane (RTG) fleet by 30 to a total of 146.
March also capped an active third quarter, which helped to deliver a 15.3 percent increase in TEU volumes for the fiscal year that began July 1, 2014. During those nine months, GPA moved 2.66 million TEUs, an increase of 352,381 from the comparable period of FY 2013-14.
The GPA also reports fiscal-year-to-date increases of 7.6 percent for breakbulk cargo (to 2.04 million tons) and 4.1 percent for bulk (to 2.21 million tons). Breakbulk includes non-containerized general cargo such as steel, paper, and rubber. Bulk cargo ranges from wood pellets to vegetable oil and other agricultural products.
Container ship at the GPA’s Garden City Terminal on the Savannah River. The Port of Savannah moved 2.66 million TEUs through March of FY 2014-15. GPA photo/Stephen B. Morton
Mount Vernon Port Breaks Indiana Shipping Record
The Port of Indiana-Mount Vernon set a record in first quarter 2015 by handling more freight tonnage in a single quarter than any of the state’s public ports. It was port’s second consecutive quarterly record.
First quarter shipments increased 3.0 from fourth quarter of 2014 and were up 48 percent compared to first quarter 2014, thanks in great part to a 36 percent jump in grain shipments.
"Being located in the most fertile agricultural region in the world, grain is one of the largest volume commodities handled through the Port of Indiana-Mount Vernon," said Mount Vernon Port Director Phil Wilzbacher. "On an annual basis, port companies trade or process approximately 75 million bushels of corn, soybeans and wheat. During the first quarter, Consolidated Grain and Barge handled a significant increase in corn shipments. CGB is a very progressive grain trading business and our partnership with this company continues to grow even after more than 30 years."
But there were other positives, as well. Fertilizer and steel shipments were up 16 percent and 10 percent, respectively. Substantial gains were posted by minerals and magnetite volumes. Shipments by Alliance Coal, which account for just over half of the port’s total tonnage, exceeded year-earlier tonnage by a significant margin.
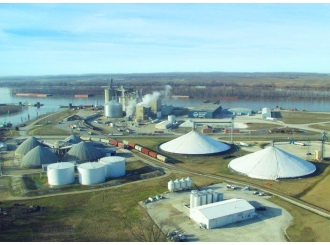
Located on the Ohio River in Southwest Indiana near Evansville, the port is a multimodal hub connecting the Midwest to world markets with year-round routes to the Gulf of Mexico, over 20 states and the Great Lakes via the U.S. Inland Waterways System. The port also provides connections to five Class I railroads and ocean vessels in the Gulf of Mexico. The port handles cargo bound to or from 20 countries and 44 states.
Mount Vernon is one of three public ports administered by the state port authority, Ports of Indiana, from its headquarters in Indianapolis. The others are the Jeffersonville on the Ohio River and Burns Harbor on Lake Michigan.
Indiana Port of Mount Vernon
Photo/Ports of Indiana
San Pedro Ports Container Volume Up 23% in March
The San Pedro Harbor ports of Long Beach and Los Angeles together handled container volumes totaling just over 1.4 million TEUs in March, up from just 915,777 TEUs in strike-impacted February and a 23.4 percent increase from the March 2014 total of 1.1 million TEUs. In detail, the data show increases from a year ago of 35.4 percent for inbound loads, 54.1 percent for empty containers and a 20.1 percent drop for outbound loads. That brought year-to-date volume at America’s largest container handling complex to nearly 3.3 million TEUs down 4.3 percent from first quarter 2014.
   
|