
| October 28, 2014 | |
Port Cargo Trends: Global Port Tracker, Fortaleza (Brazil), Long Beach/Los Angeles, North Carolina, Oakland, Redwood City, Tacoma
![]() Print this Article | Send to Colleague
Print this Article | Send to Colleague
Global Port Tracker: Retail Imports to Set New Record in Final Surge before Holidays
Imports at the top U.S. containerized retail cargo handling ports will experience a final surge and set a new monthly record in October as the holiday season approaches, predicts the monthly Global Port Tracker report released October 10 by the National Retail Federation and Hackett Associates.
Global Port Tracker’s conclusions are based on its survey and analysis of inbound container traffic flows at the ports of Charleston, Hampton Roads, Houston, Long Beach, Los Angeles, Miami, New York/New Jersey, Oakland, Port Everglades, Savannah, Seattle and Tacoma.
"Increasing congestion at the nation’s ports as well as the ongoing West Coast labor negotiations are ongoing concerns and retailers are making one last push to make sure they’re stocked up for the holidays," said NRF Vice President for Supply Chain and Customs Policy Jonathan Gold. "Retailers are working hard to make sure customers can find what they’re looking for regardless of what happens at the ports."
Import volume at U.S. ports covered by the Global Port Tracker report is expected to total 1.53 million TEUs this month, topping the monthly record of 1.52 million TEUs set in August. Cargo volume has been well above average each month since spring as retailers have imported merchandise early in case of any disruption on the docks.
The 1.52 million TEUs handled in August, the latest month for finalized numbers are available, was up 1.5 percent from the previous month and 2.1 percent from August 2013.
Subsequent month estimates and forecasts: September – 1.48 million TEUs ( 2.8 percent); October – 1.53 million TEUs ( 6.4 percent); November – 1.39 million TEUs ( 3.7 percent); December – 1.37 million TEUs ( 3.9 percent); January 2015 – 1.42 million TEUs ( 3.5 percent); February – 1.35 million TEUs ( 8.5 percent).
The CY 2014 total is forecast to reach of 17.1 million TEUs, up from 16.2 million in 2013 and 15.8 million in 2012.
"The consumer is back," Hackett Associates Founder Ben Hackett said, citing reduced unemployment, improved consumer confidence and other indicators. "That’s all good news for retailers, ports and shipping lines."
Fortaleza (Brazil): Container Trade Up 14 Percent
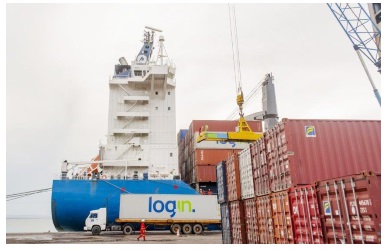
Container dock activity at the Port of Fortaleza.
Source/Companhia Docas do Ceará
Container volumes at the Port of Fortaleza totaled 70,265 TEUs during the first nine months of 2014, an increase of 14.1 percent from a year ago, according to the data reported by the state port authority, Companhia Docas do Ceará. Of that, cabotage movements between Fortaleza and other Brazilian ports accounted for 41,984 TEUs and overseas trade for the balance.
The cabotage trade consisted of containerized rice inbound from the ports of Rio Grande and São Francisco do Sul and shipments of salt outbound to unspecified destinations. Foreign trade included fruit such as melons and bananas exported to Europe and malt imported from France and Belgium.
The port’s trade overall during that nine-month period grew by 1.2 percent to just over 3.7 million metric tons, including exports of nearly 3.5 million tons and imports amounting to just 215,572 tons.
Liquid bulks alone accounted for 2.0 million tons, or 55 percent of total cargo, and included gasoline, diesel fuel, crude oil, liquefied petroleum gas, aviation fuel, and palm oil.
Dry bulks at nearly 1.1 million tons (29 percent) included wheat, petroleum coke, clinker, sulfur, phosphates, and mineral fertilizer.
General cargo, including containerized goods, amounted to 596,003 tons (16 percent), and in addition to the previously cited items included tile, paper, brake drums, furniture, frozen chicken, carnauba wax and cashew nuts.
San Pedro Ports Container Volume Jumps 8% in September
The San Pedro Harbor ports of Long Beach and Los Angeles together handled container volumes totaling just over 1.4 million TEUs in September, up from 1.2 million TEUs in the preceding month, and an 8.2 percent from the September 2013 total of 1.3 million TEUs. In detail, the September data show increases of 10.6 percent for inbound loads and 15.2 percent for empty containers and a 5.6 percent drop in outbound loads. That brought year-to-date volume at America’s largest container handling complex to a seven-year high of nearly 11.4 million TEUs and an increase from January-September 2013 of 5.0 percent. Click here for details.
North Carolina: Port of Wilmington Sees Significant Container Volume Growth
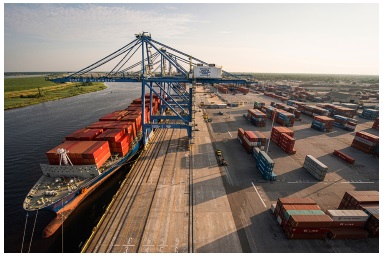
North Carolina’s bustling Wilmington container terminal.
Photo/North Carolina State Service
The North Carolina State Ports Authority (SPA) ended the first quarter of the fiscal year that began July 1 with a 22 percent increase in container throughput at the Port of Wilmington. Volume jumped 26.1 percent in August and 38.1 percent in September.
The SPA attributes this year’s growth to more ship calls and services in Wilmington’s Asian and Latin American trades.
"The lack of congestion at the North Carolina Ports, along with unrivaled customer service, makes us easy to do business with and in the end, the choice ports on the East Coast," said Chief Executive Officer Paul J. Cozza. "Our container volumes are a result of increased service offerings and our commitment to meeting customer demands. We will work hard to sustain this positive momentum and carry it into the next quarter."
September was Oakland’s Busiest Month in More Than a Year
September was the busiest month at the Port of Oakland in more than a year, with container volumes of 207,412 TEUs, a year-on-year increase of 2.9 percent and the most since August 2013. Compared to a year ago, this September’s data show increases from September 2013 of 7.1 percent for inbound loads and a 7.3 percent drop in outbound loads.
August-September is traditionally the peak shipping season for imported holiday merchandise.
The port says it experienced no chassis shortages in September. It blames the strong U.S. dollar for the drop in export cargo.
Volume for the year through September amounted nearly 1.8 million TEUs, a 1.6 percent increase from last year. The attachment provides details.
Redwood City Port Shipping Business Up 23%
The Port of Redwood City reports 451,031 metric tons of cargo crossed its docks during the first quarter of the fiscal year that began July 1, a 23-percent increase from first quarter FY 2014.
Imported sand accounted for half this year’s tonnage; other commodities included imported aggregates (32 percent); exported shredded scrap metal (10 percent); imported bauxite (6 percent) and domestic sand (2 percent).
Sand and aggregates remain in high demand by local ready-mix concrete suppliers who provide materials for construction projects on the Peninsula and Silicon Valley.
Twenty-nine vessels (15 ships, 14 barges) made calls during the first quarter compared to year earlier totals of 18 vessels (13 ships, 5 barges) during the prior first quarter.
The first quarter gains follow the 19 percent cargo tonnage increase reported by the port for all of FY 2014 (Advisory, August 5, 2014). Last year’s 1,784,659 metric tons was the port’s highest total since 2006 and its third highest ever.
Tacoma Container Volumes Post Busiest Month Since 2005
Container volumes through the Port of Tacoma surged in September, posting a 20 percent gain over the same month last year and marking the busiest month since September 2005.
Tacoma handled 1.6 million TEUs (20-foot equivalent units) through September, a 10 percent increase year to date. Full containerized imports grew 13 percent year to date to 590,418 TEUs, while exports improved 9 percent to 418,713 TEUs. Domestic volumes posted a 4 percent gain year to date to 355,766 TEUs.
![]()
![]()
![]()
![]()

|
Asociación Americana de Autoridades Portuarias
1201 Maryland Ave SW, Suite 860, Washington, D.C. 20024
E: info@aapa-ports.org
W: www.aapa-ports.org