Port Traffic Metrics: United States, Long Beach, Oakland, Port Everglades, Virginia
![]() Print this Article | Send to Colleague
Print this Article | Send to Colleague
America’s seaports handled nearly 1.3 billion metric of foreign trade in 2016, an increase of 1.5 percent compared to 2015, according to data collected and reported by the U.S. Census Bureau. Exports totaled 611.5 million tons, up 2.9 percent from 2015 but short of 2014’s record 614 million tons. Imports rose slightly to 673 million tons.
Contrastingly, the value of trade dropped, by 5.6 percent to $1.48 trillion, with exports down by 7.2 percent and imports by 4.8 percent from their 2015 levels.
Asia remained America’s leading trading region, with cargo volume from January through December of 413 million tons (+7.4 percent) valued at nearly $772 billion (-1.0 percent). The strongest growth came from India and the ASEAN bloc, with cargo tonnage increases of 13.7 and 16.4 percent, respectively.
Within the Western Hemisphere, tonnage gains from 2015 occurred in U.S. trade with Central America, while its Canadian, Mexican, South American, and Caribbean trades all declined.
Elsewhere, the data show tonnage gains for U.S. seatrade with North Africa, Sub-Saharan Africa and the Middle East and declines in its European and Australian/Oceania trades. Click here for comparisons of the volume and value of U.S. Seaborne Trade by World Region 2015-2016.
Twenty-five countries generated roughly 77 percent of the volume and 80 percent value of U.S. international waterborne trade in 2015. Five alone — China, Mexico, Canada, Saudi Arabia, and Brazil — accounted for 35 percent of total tonnage; 47 percent of the dollar total came from trade with China, Japan, Germany, South Korea and the United Kingdom. Click here for U.S. Seatrade 2016 Rankings by Trading Partner.
New Orleans was the top U.S. Customs district in 2016 based on export, import and total foreign seaborne cargo tonnage. Ranked by dollar value, the Los Angeles district stood first in imports and total trade. Houston/Galveston topped the export list. Note that some customs districts encompass more than one seaport. Click here for U.S. Waterborne Foreign Trade 2016 by Customs District.
Long Beach Port Traffic Surges in January
Renewed activity at the Port of Long Beach’s largest terminal and extra ships calling ahead of the Lunar New Year helped boost the January box count to 582,689 TEUs, an 8.7 percent increase from January 2016. That included increases of 10.8 percent for outbound loads, 7.4 percent for inbound loads, and 9.6 for empty containers. Click here to learn more.
Growth was spurred by the port’s Pier T terminal, which is operated by Total Terminals International (TTI). Terminal Investment Limited (TIL), a subsidiary of Mediterranean Shipping Co. (MSC), purchased a majority stake in the terminal following the bankruptcy last year of Hanjin Shipping.
This January’s upsurge was notable since TEU traffic in January 2016 jumped 25 percent from the same month in 2015.
"It was a tough benchmark, so we’re very happy with the way the new year is starting in Long Beach," said Board of Harbor Commissioners President Lori Ann Guzmán. "This year, we’ll be laser-focused on furthering our new partnership with MSC and continuing to provide efficient and rapid service to all of our customers."
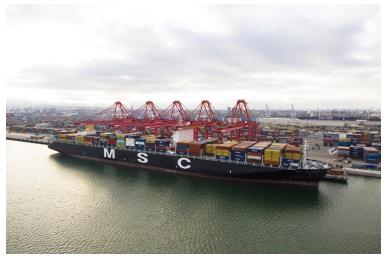
MSC container ship at Long Beach’s Pier T Terminal
Photo/Port of Long Beach
Oakland Export Gains Continue
The Port of Oakland reports export container volume rose again in January, up 9.0 percent from a year ago to 73,352 TEUs. It was the port’s seventh consecutive month of export gains and the 12th increase in 13 months.
The January data also included gains from January 2016 of 3.6 percent for imports, 6.1 percent in loaded containers and 3.2 percent in total volume (to 197,312 TEUs).
"We’ve been cautiously optimistic about 2017 cargo volumes and this is a solid start to the year," said Maritime Director John Driscoll. "In particular, we’re gratified by the continued success in our export business."
Agricultural commodities continue to drive Oakland export increases, the port said, noting, for example, that "strong harvests and aggressive marketing helped boost overseas sales of California almonds last month."
Import volume increased in January as U.S. shippers stocked inventories ahead of Lunar New Year holidays. Manufacturers in Asia sometimes close factories for up to two weeks.
Port Everglades Records Record High in December
Port Everglades’ container throughput reached a monthly high in December of 104,590 TEUs, a 15-percent increase compared to December 2015. It was the port’s third month of double-digit growth since September.
"Our customers are bringing in higher volumes of consumer goods such as produce, clothing and household goods as the region's population increases," said Port Director Steven Cernak, PPM®. "It's an indication of a strengthening economy."
The port attributes the increase to resurgent trade, especially perishables, with Costa Rica and the Dominican Republic, and a change in vessel sharing agreements between Crowley Liner Service and Seaboard Marine.
"Port Everglades helped spearhead a pilot program to bring refrigerated produce from South America directly to Florida, when it was previously restricted to only coming into northern U.S. ports," said Jim Pyburn, Port Everglades Director of Business Development. "The pilot program was a great success and now we are seeing a wider variety of produce coming to South Florida faster and fresher than when it was trucked here from the Northeast."
New shipping services also contributed to the increase.
In July, Hapag-Lloyd began a direct call to Port Everglades from Valencia, Spain, on its Mediterranean Gulf Express (MGX) service. The MGX service added approximately 300 to 400 TEUs weekly at Port Everglades.
SeaLand and APL's North American Express Service (NAE/ACX) began service to Latin America in late 2015, and has been increasing its volumes in the first full year at Port Everglades. Port Everglades is the first and last U.S. call for this weekly, year-round service.
The Port of Virginia® set a January record this year with container volumes through its Hampton Roads facilities totaling 228,516 TEUs. That was up 8 percent from January 2016, and came despite two lost workdays due to heavy snow.
Other January data, as detailed in the attachment, show double-digit gains for containerized cargo tonnage, vehicle units, and container box moves via rail, truck, barge, and the Virginia Inland port.
The continued growth comes as the port prepares to begin work on its three-year capacity expansion plan at Virginia International Gateway (VIG) and Norfolk International Terminals.
"We have had 12 consecutive months of volume exceeding 210,000 TEUs, so we are seeing consistency and it is our belief that there will be additional growth in the coming months," said John F. Reinhart, CEO and executive director of the Virginia Port Authority. "We are going to break ground on the expansion at VIG in the next few days and the focus is maintaining our service levels and overall cargo flow as we move into heavy construction. The volumes we are seeing are a clear indicator that we are adding capacity at the right time. We understand the challenges going forward, but we are confident in our plan and the end result of this effort will put the Port of Virginia on the path to growth and sustainability for decades to come."
Back to AAPA Seaports Advisory
![]()
![]()
![]()