Port Performance Metrics: Delaware River, Indiana, Los Angeles, Seattle/Tacoma
![]() Print this Article | Send to Colleague
Print this Article | Send to Colleague
Delaware River 2015 Vessel Arrivals Highest Since 2008
Delaware River private and public port facilities in Delaware, New Jersey, and Pennsylvania handled 2,242 ships in 2015, reports the Maritime Exchange for the Delaware River and Bay. That was up 5.0 percent from 2014 and gave the tristate port complex its best year since 2008.
"We are finally starting to turn the corner after the 2008-2009 economic downturn," said Maritime Exchange President Dennis Rochford Rochford. "The increase is due to changes in both import and export commodities as our port profile has evolved. In the last five years, the import market has seen growth in ships carrying various fruit, steel, mineral, and vehicle products as well as paper and wood cargos. Exports saw growth in natural gas liquids, mineral, and petroleum products."
The substantial growth in exports was due in part to the expansion of the Marcus Hook Industrial Complex. Gas products from the Marcellus Shale region of Pennsylvania are transported to Marcus Hook and loaded aboard ships bound for delivery to markets overseas and elsewhere in the United States.
"In addition to growing market confidence, shippers and carriers are aware that work to deepen the Delaware River main shipping channel is nearing completion," Mr. Rochford said. "This, coupled with expansion projects in Paulsboro, N.J. and at the Southport site at the old Philadelphia Navy Yard, as well as plans to expand port capacity in Delaware, is creating real buzz about the Delaware River as a port of destination."
Port of Indiana-Mount Vernon shatters all-time shipping record
Port of Indiana-Mount Vernon handled a record 6.6 million tons of cargo in 2015. That was up 36 percent from 2014 and beat by 30 percent the previous record of the 40-year old Ohio River port set in 1994.
"The credit for the record volume rightfully goes to our world-class port companies, without them we would not be enjoying the success we have today," said Port Director Phil Wilzbacher. "By utilizing our port's multimodal connections, these companies can choose the most cost-effective logistics routes, grow their business and create commerce that extends well beyond southwest Indiana and the Midwest."
Coal, agricultural products, steel as well as other bulk commodities helped drive the year's significant increase in cargo volume. Steel shipments nearly doubled their 2014 volume, while salt tonnage increased five-fold. Other year-on-year gainers were ethanol (+105 percent), coal (+82 percent), dried distillers grain (+64 percent), cement (+17 percent) and limestone (+52 percent).
During the year as well, the port handled approximately 3,600 barges, 37,000 rail cars and 160,000 trucks.
The Port of Indiana-Mount Vernon contributes more than $1 billion in total economic activity per year and supports 7,200 total jobs. Its tenant companies generate cargo bound to or from 44 states and 20 countries.
Mount Vernon is one of three ports owned and managed by the state port authority, Ports of Indiana, from its headquarters in Indianapolis. The others are Burns Harbor on Lake Michigan and Jeffersonville on the Ohio River.
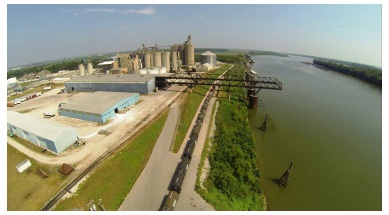
Port of Indiana-Mount Vernon
Photo/Ports of Indiana
Port of Los Angeles Handles 8.1 Million TEUs in 2015
Container movements through the Port of Los Angeles totaled of 8,160,457 TEUs in 2015, a decrease of 2.1 percent compared to 2014.
"I’m pleased that the Port of Los Angeles has surpassed the 8-million TEU threshold for the fifth time in our history," said Port of Los Angeles Executive Director Gene Seroka. "Despite the soft start to the year, our terminals, labor force and supply chain stakeholders rebounded strongly. With bigger ships and the ongoing work to increase supply chain efficiencies, we look forward to building on this momentum in 2016."
The December count, 626,276 TEUs, was down 4.9 percent from December 2014, reflecting drops of 4.5 percent for imports and 13.7 percent for exports. A cargo terminal was offline for several weeks in December in order to install new software, which was the primary reason for the drop in cargo.
Current and past data container counts for the Port of Los Angeles may be found at: http://www.portoflosangeles.org/maritime/stats.asp.
Seattle/Tacoma: Northwest Seaport Alliance tops 3.5 million containers in 2015
The Puget Sound container trade rebounded in 2015, with the Northwest Seaport Alliance handling more than 3.5 million TEUs at its Seattle and Tacoma terminals, an increase of 4 percent compared to 2014.
Container volumes grew despite the slowing Chinese economy and volume declines earlier in the year during West Coast labor negotiations.
International containers grew 8 percent. Full containers fueled the nearly 5-percent gain in imports to 1.4 million TEUs. Export containers improved 12 percent to 1.3 million TEUs, powered by the high volume of empty containers being sent back to Asia.
Domestic volumes fell 8 percent to 768,635 TEUs. Alaska’s economy has slowed due to record low oil prices, resulting in less oil and gas-related project cargo heading north.
Auto imports reached a new record in 2015, up 4 percent to 183,305 vehicles. Meanwhile breakbulk cargo—items too large or bulky to fit in a container—fell nearly 8 percent.
The ports of Seattle and Tacoma formed The Northwest Seaport Alliance in August 2015 to strengthen the Puget Sound gateway—the third largest in North America—and create more economic opportunities.
"The Northwest Seaport Alliance allows us to compete more effectively on behalf of our customers and attract more cargo to the Puget Sound region, which translates to more family-wage jobs in our communities," said CEO John Wolfe. "With the strong support from our labor partners, along with a focus on operational excellence, customer care and strategic infrastructure investments, we expect to continue to see an increase in cargo volumes and related jobs in the region."
For detailed port traffic data, click on 2015 container volumes and 2015 cargo statistics.
Back to AAPA Seaports Advisory
![]()
![]()
![]()