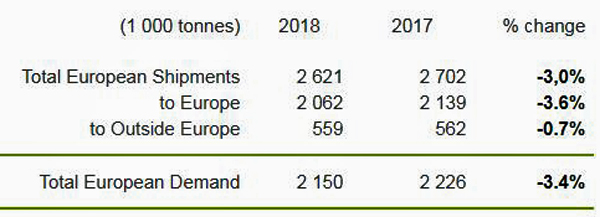
The figures below represent the year-on-year percentage change for total European shipments and total European demand for graphic papers recorded in metric tons for the period of June 2017 - June 2018 as per the European Association of Graphic Paper Producers (Brussles, Belgium). Reports by the association on their Euro-Graph online publication are updated on a monthly basis, usually on the 25th of the month or on the next working day following a weekend or bank holiday.
TAPPI
http://www.tappi.org/